Geomagnetic Storm History: 30 Years of Kp Data
Explore 30 complete years of geomagnetic storm history, 1996–2025, with annual Kp threshold counts, rankings, charts and downloadable source data.
The short answer
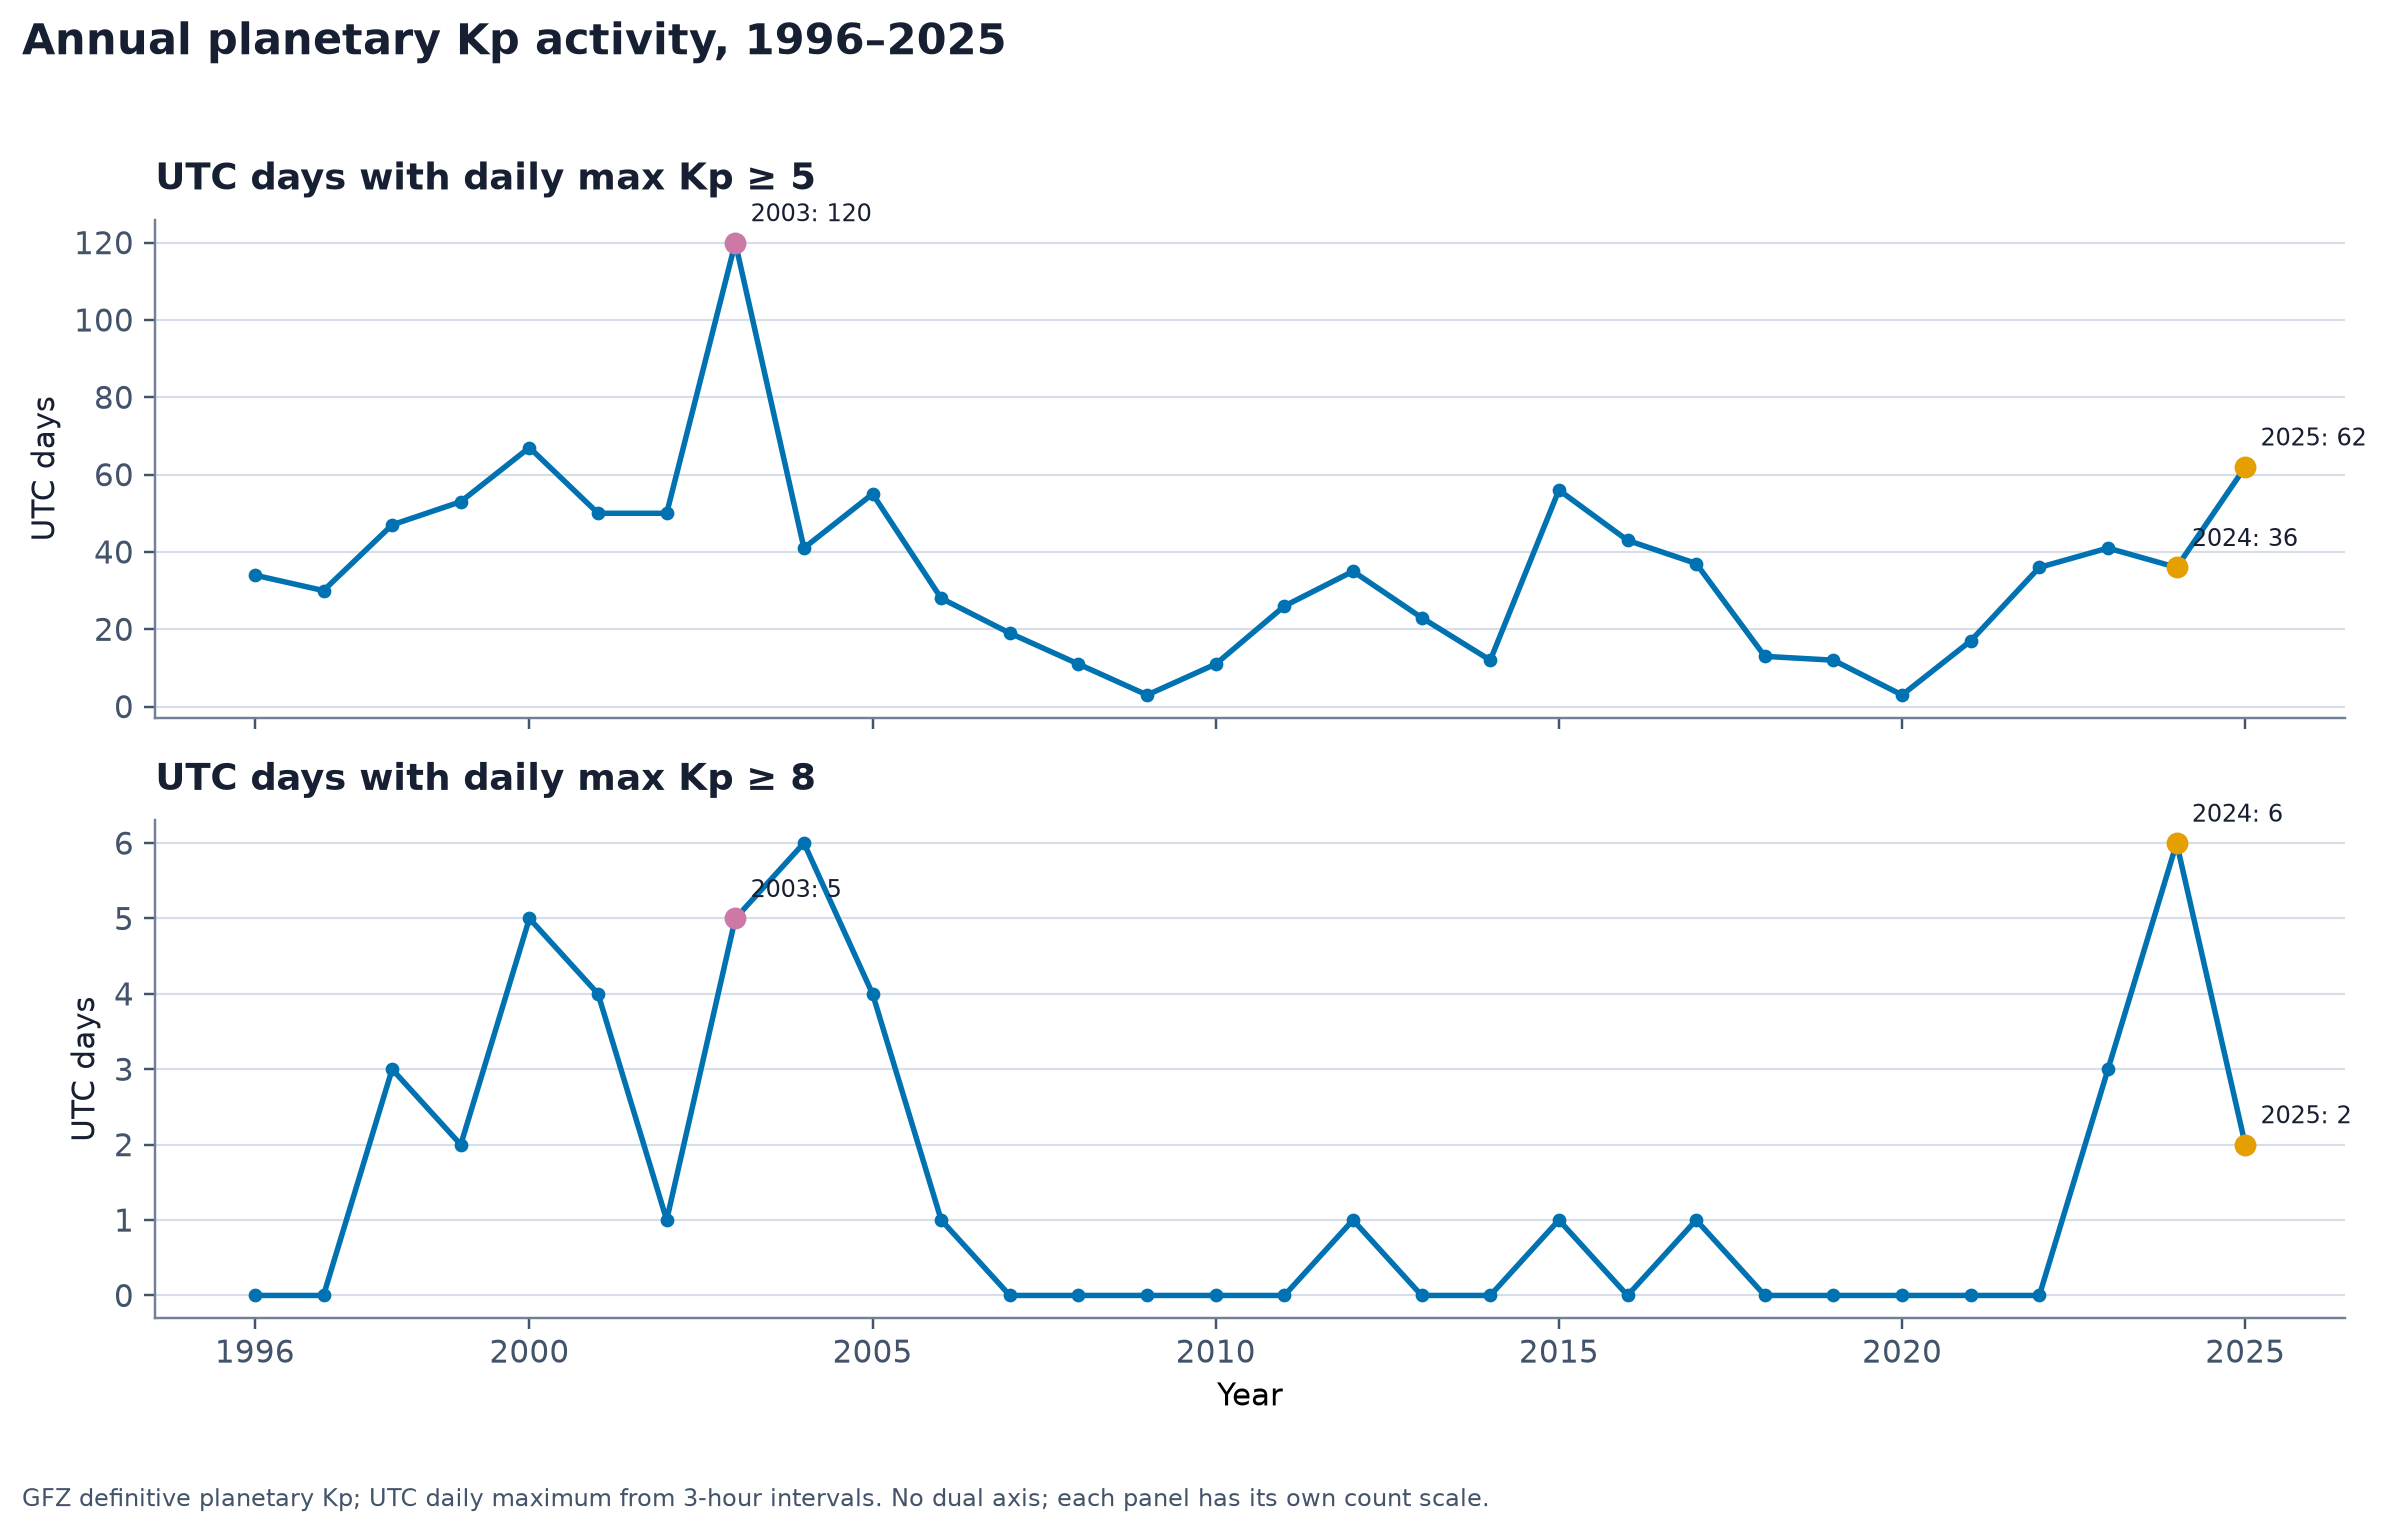
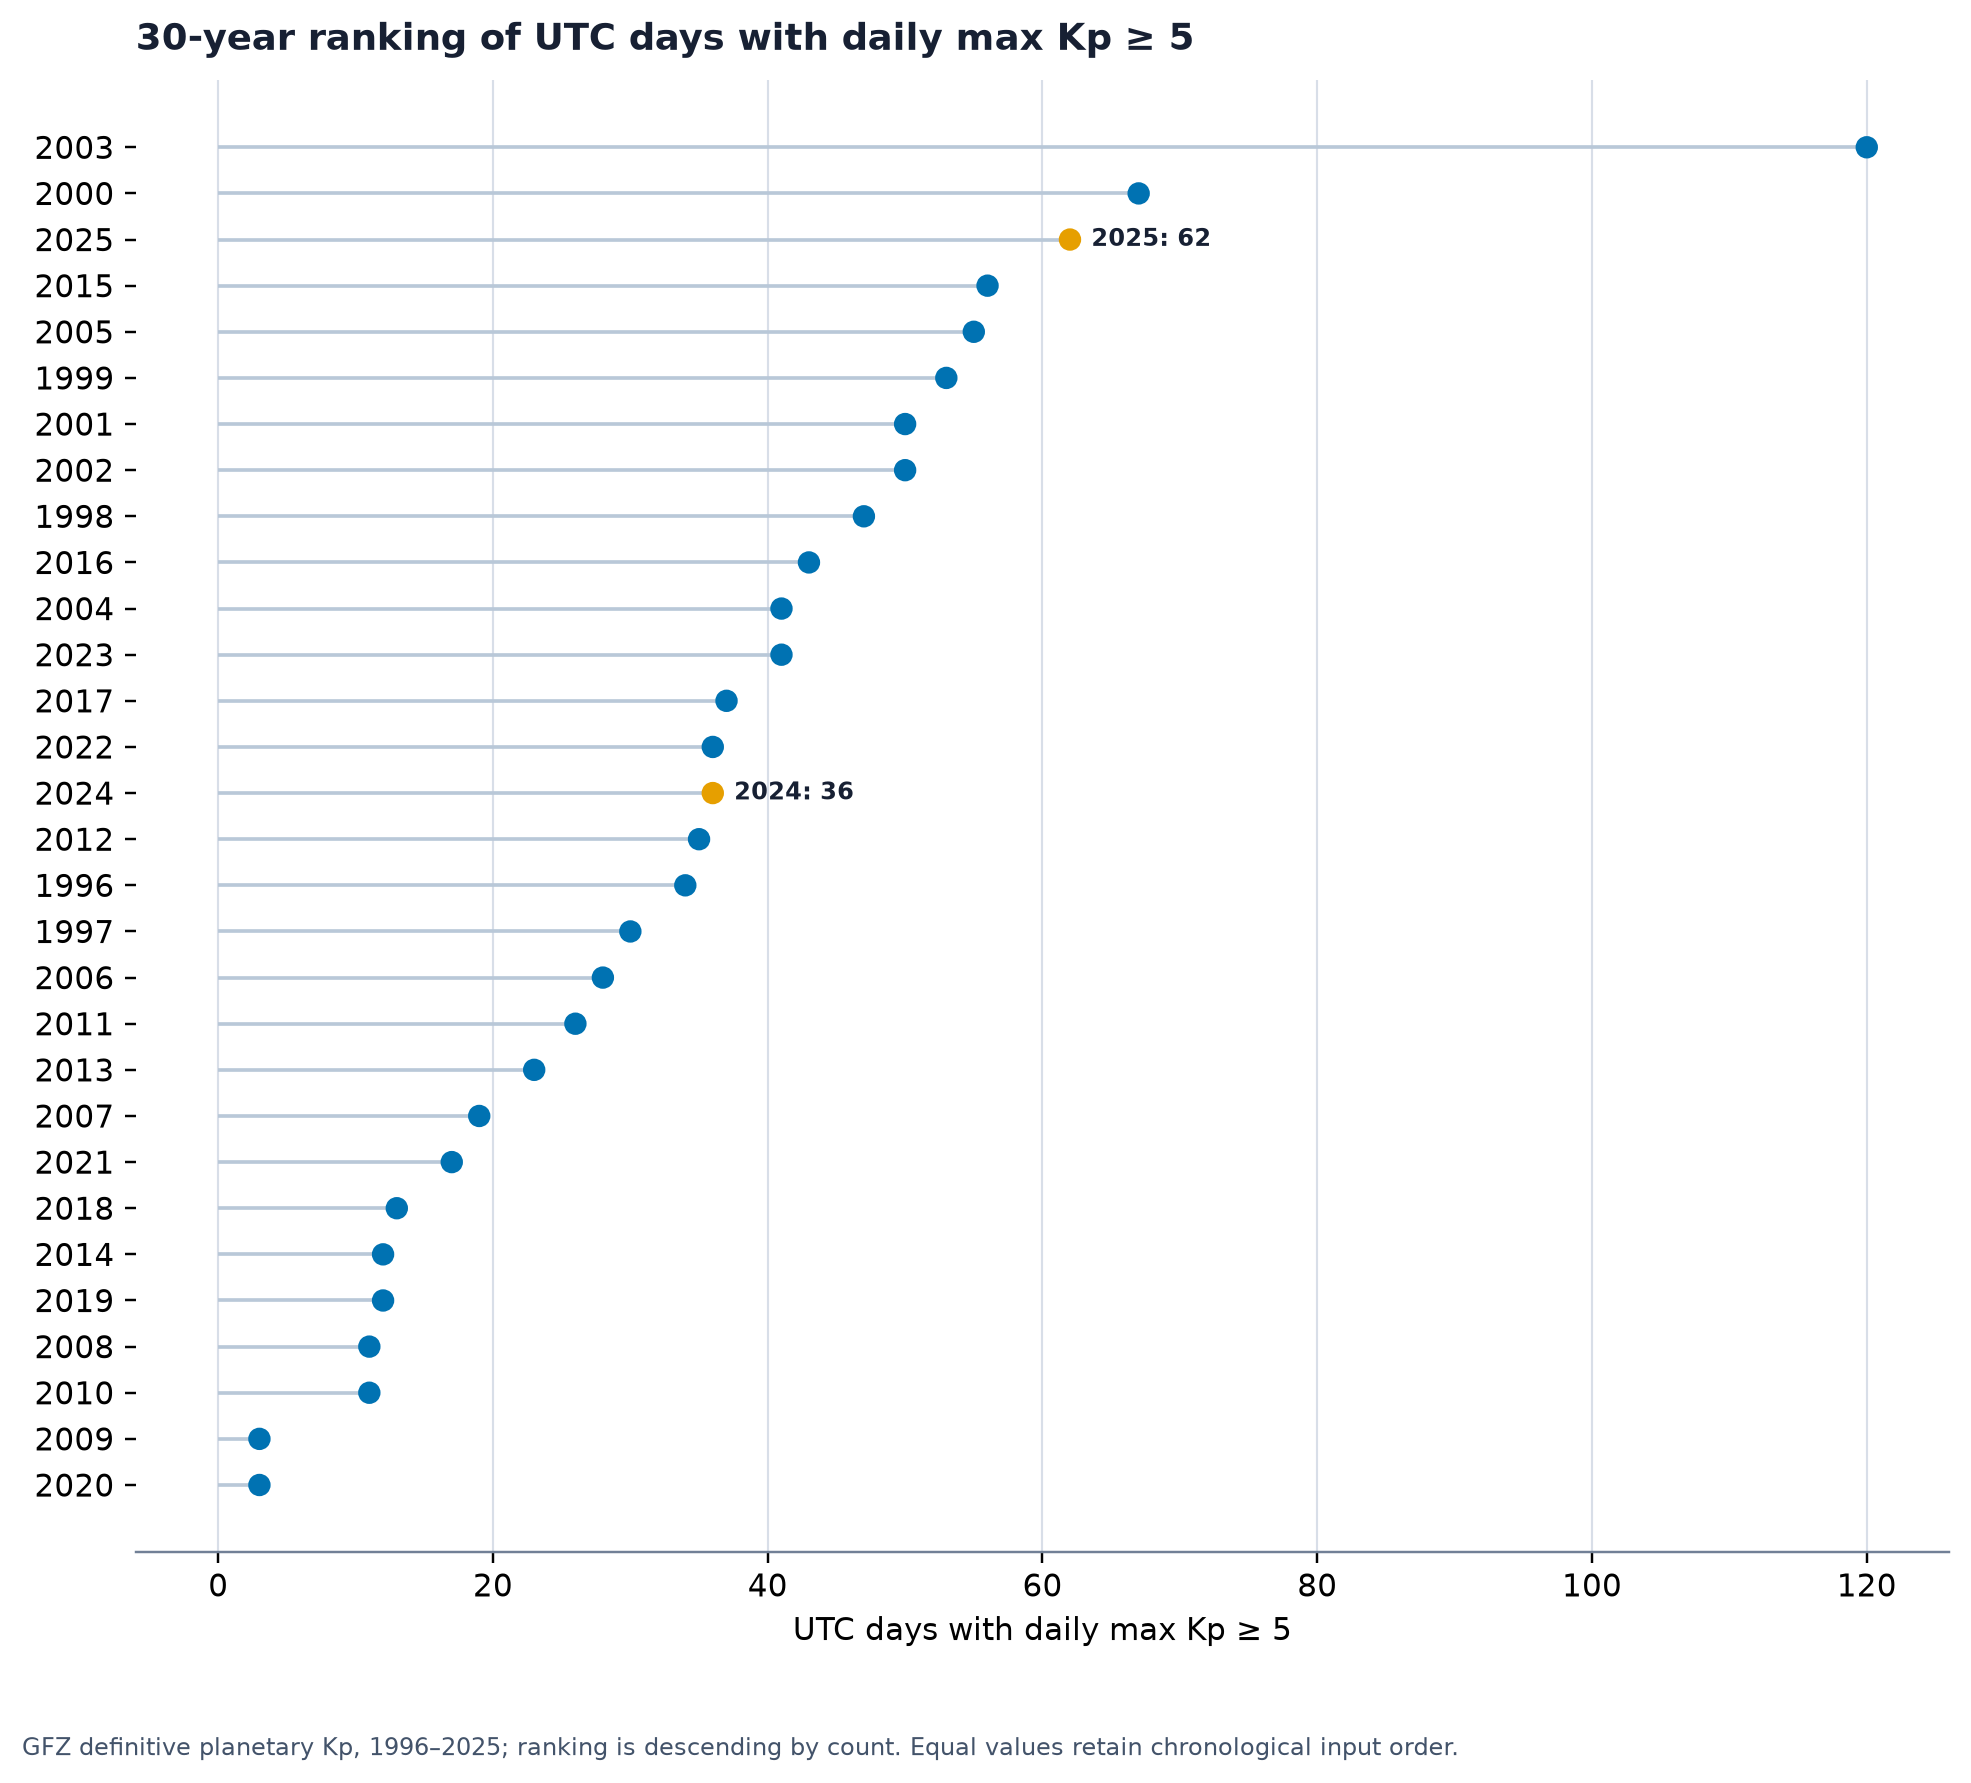
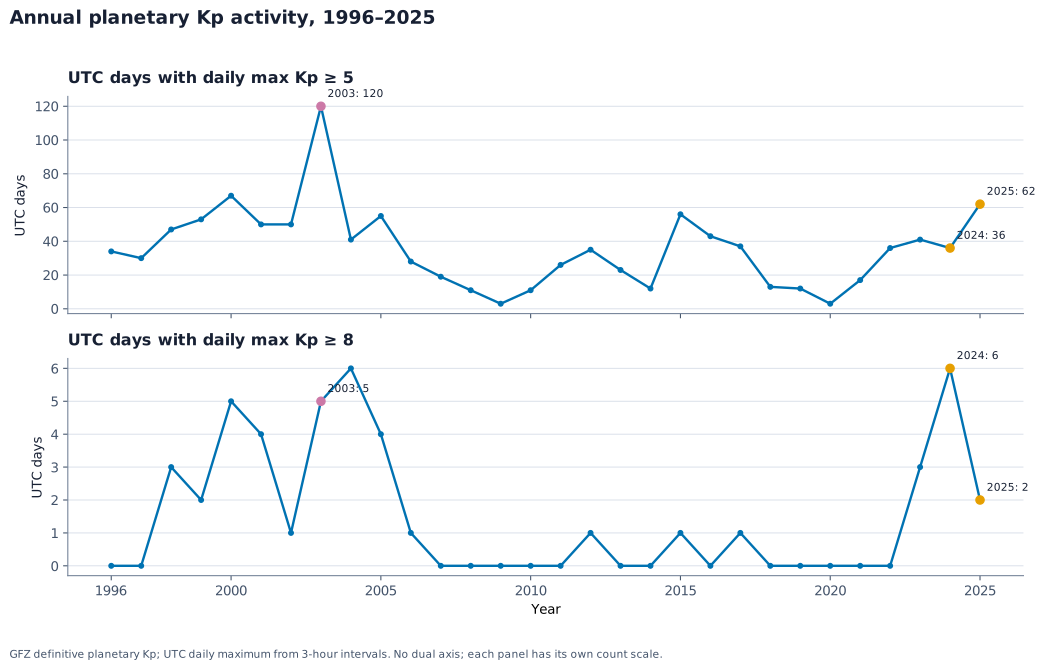
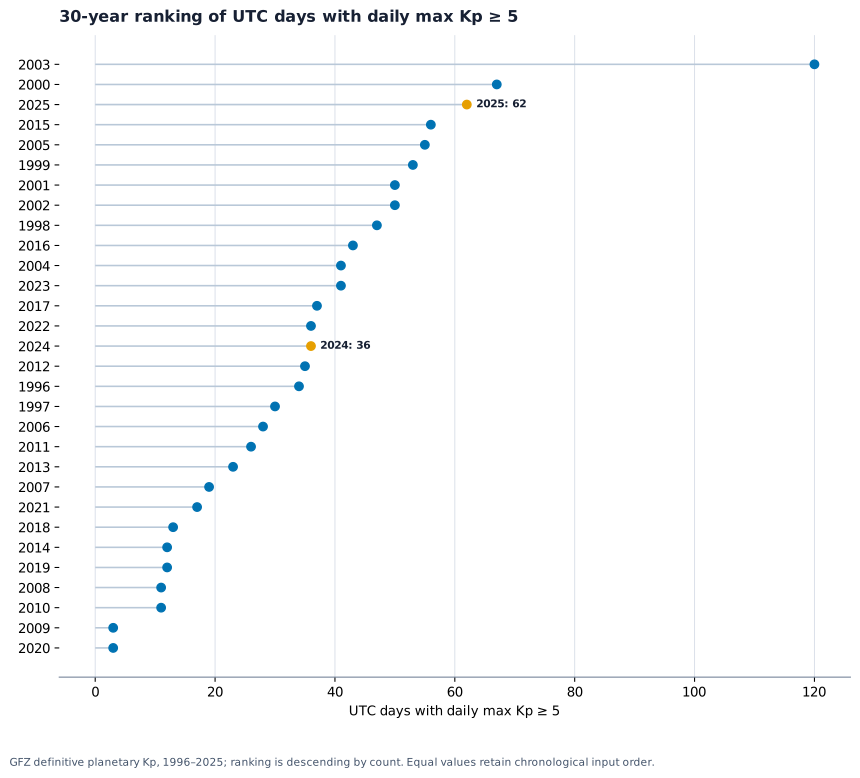
The complete definitive Kp record for 1996–2025 does not support one simple league table called “most active year.” It supports several transparent rankings. On one broad measure — UTC days with at least one Kp value at or above 5.0 — 2003 ranks first with 120 days, followed by 2000 with 67 and 2025 with 62. On a rarer threshold — UTC days with at least one Kp value at or above 8.0 — 2004 and 2024 tie for first with six days each.
Those two results describe different parts of the distribution. A year with many Kp ≥5.0 days is not automatically the year with the most Kp ≥8.0 days. Recent activity belongs in the historical record, but the record does not justify a claim that one modern year was universally more severe, nor does it measure the number of aurora displays people saw.
A record built from three-hour UTC intervals
The Kp index is a planetary measure of geomagnetic activity. GFZ’s definitive archive has yearly files from 1932 onward; the 1996–2025 window used here contains 30 complete calendar years. Every year in this subset has 100.0% expected coverage. That means 87,664 native three-hour intervals in total: eight per UTC day, with leap years carrying eight additional intervals.
Kp is not a conventional linear scale. It is reported in thirds — for example 5.0, 5.333 and 5.667 — and the official data format represents each of the eight UTC intervals separately. The GFZ data description says to use the derived linear Ap index rather than the historic daily Kp sum for scientific daily aggregation. The analysis therefore ranks two auditable threshold counts rather than calculating an average or sum of Kp.
The first count is a UTC day with at least one interval at Kp ≥5.0. The second is a UTC day with at least one interval at Kp ≥8.0. These are actual numerical thresholds. NOAA associates integer Kp values 5 through 9 with its G1 through G5 scale, but these figures are not presented as a count of NOAA-classified events. The thresholds are simply a reproducible way to show how often the planetary record reached two very different levels.
The 30-year rankings
| Rank by Kp ≥5.0 UTC days | Year | Qualifying UTC days | Kp ≥8.0 UTC days in the same year |
|---|---|---|---|
| 1 | 2003 | 120 | 5 |
| 2 | 2000 | 67 | 5 |
| 3 | 2025 | 62 | 2 |
| 4 | 2015 | 56 | 1 |
| 5 | 2005 | 55 | 4 |
| 6 | 1999 | 53 | 2 |
| 7= | 2001 | 50 | 4 |
| 7= | 2002 | 50 | 1 |
The counterpart ranking is shorter at the high threshold. 2004 and 2024 jointly lead the 30-year window with six UTC days at Kp ≥8.0. Five days occurred in 2000 and 2003; four in 2001 and 2005; and three in 1998 and 2023. The ranking is tie-aware: equal counts share a rank rather than being separated by an unstated tiebreaker.
This is why a single annual headline can mislead. 2025 ranks third on the broader threshold but has only two Kp ≥8.0 days. 2024 has 36 Kp ≥5.0 days — tied with 2022 in this series — but ties for the high-threshold lead. The measures are both true and answer different questions.
What the long-run pattern can tell us
The series shows strong year-to-year variation. At the broad threshold, the quietest complete years in this 30-year window were 2009 and 2020, each with three qualifying UTC days. At the upper threshold, 14 of the 30 complete years had no Kp ≥8.0 UTC day. That contrast is useful because it prevents a reader from mistaking a single count for the whole shape of a year.
The 2003 value stands out: 120 UTC days with a daily maximum at or above Kp 5.0, nearly twice the count in second-place 2000. One extended or recurring disturbed period may touch many three-hour intervals and more than one UTC day.
The recent values also require context. 2023 recorded 41 Kp ≥5.0 days and three Kp ≥8.0 days; 2024 recorded 36 and six; 2025 recorded 62 and two. 2025 was broad in the Kp ≥5.0 measure, while 2024 had the stronger high-threshold count. Neither implies local viewing outcomes or a long-run trend.
Solar-cycle context without a causal shortcut
Solar activity varies on an approximately 11-year cycle, and NOAA describes geomagnetic storms as generally more frequent near solar maximum. That pattern is useful context for a long record. It is not an explanation for every peak or trough. NOAA’s space-weather primer explicitly notes that storms also occur in the declining phase through high-speed solar-wind streams.
The immediate solar-wind conditions matter as well. NOAA’s CME reference explains that CME speed, direction, density and especially magnetic-field direction affect the resulting geomagnetic response; key magnetic-field information is unavailable until measured upstream of Earth. A graph that places Kp counts against solar-cycle context can help orient a reader in time, but it cannot prove that the cycle caused a particular year’s count.
That restraint matters for the 1996–2025 analysis. The 30 annual summaries describe a historical ranking; a visual alignment with solar-cycle timing cannot establish why individual annual totals differed.
Limits of the record
The record measures planetary Kp in standard three-hour UTC intervals, rather than aurora sightings, local viewing conditions or societal impacts. It also does not apply an episode rule for joining consecutive elevated intervals across brief dips or UTC-year boundaries. NOAA notes that local response can differ from a globally averaged index, so these rankings cannot serve as an impact ledger.
Methods, limitations and source note
The source snapshot was retrieved on 7 November 2026 from the GFZ JSON API: upstream-gfz-definitive-1996-2025.json, 87,664 unique definitive intervals, SHA-256 5bb7ec6fcb728cdf74f0990f538ab40ed3e4fefd0996d95cc8c52dcfcdd79bc1. The source is the GFZ Potsdam Geomagnetic Kp index dataset, DOI 10.5880/Kp.0001, derived from 13 contributing observatories; GFZ specifies attribution to the dataset and Matzka et al. (2021). The data are licensed under CC BY 4.0.
Only 1996-01-01 00:00 UTC through 2025-12-31 21:00 UTC were included. Every annual row had 100.0% expected three-hour coverage. For each UTC day, the daily maximum was compared directly with 5.0 and 8.0. Counts were then summed across a complete UTC calendar year. No Kp average, Kp sum or unreported event segmentation was used. The 2026 partial record is excluded from all tables and rankings.
The resulting counts are descriptive. Threshold selection changes the ranking, UTC differs from local civil dates, and equal counts retain a shared rank. GFZ’s DOI-versioned release process can issue corrected data; the retrieval date and snapshot hash above identify the data used here.